Warning
This document is for an in-development version of Galaxy. You can alternatively view this page in the latest release if it exists or view the top of the latest release's documentation.
Debugging Galaxy Tests
Debugging Galaxy unit & integration tests in VS code
The following instructions assume that you have cloned your Galaxy fork into ~/galaxy directory.
Start VS Code
Install the Python extension for VS Code: select Extensions on Activity Bar, on the far left-hand side
Create a VS Code workspace by selecting ‘File -> Add Folder to Workspace…’ from menu and adding the
~/galaxydirectoryOptionally, save the workspace by selecting ‘File -> Save Workspace As…’ and save as ‘galaxy.code-workspace’ in the
~/galaxydirectoryAdd the following snippet to
~/galaxy/.vscode/settings.json(create the file if it does not already exist){ "python.testing.unittestEnabled": false, "python.testing.nosetestsEnabled": false, "python.testing.pytestEnabled": true, "python.testing.pytestArgs": [ "test/", "--ignore=test/shed_functional/", "--ignore=test/functional", "--ignore=test/unit/shed_unit/test_shed_index.py", "packages/test_api/" ], "python.pythonPath": ".venv/bin/python3", "pythonTestExplorer.testFramework": "pytest" }
Re-start VS Code
Choose the .venv Python as your Python Interpreter. First
Ctrl+Shift+Pthen>Python: Select Interpreter. +
Select Test on Activity Bar, on the far left hand side. You should see unit and integration tests under ‘Python’ (as shown in the image below). It may take a few seconds for the tests to load up. If they do not, click the ‘Discover Tests’ icon and wait for the tests to load.
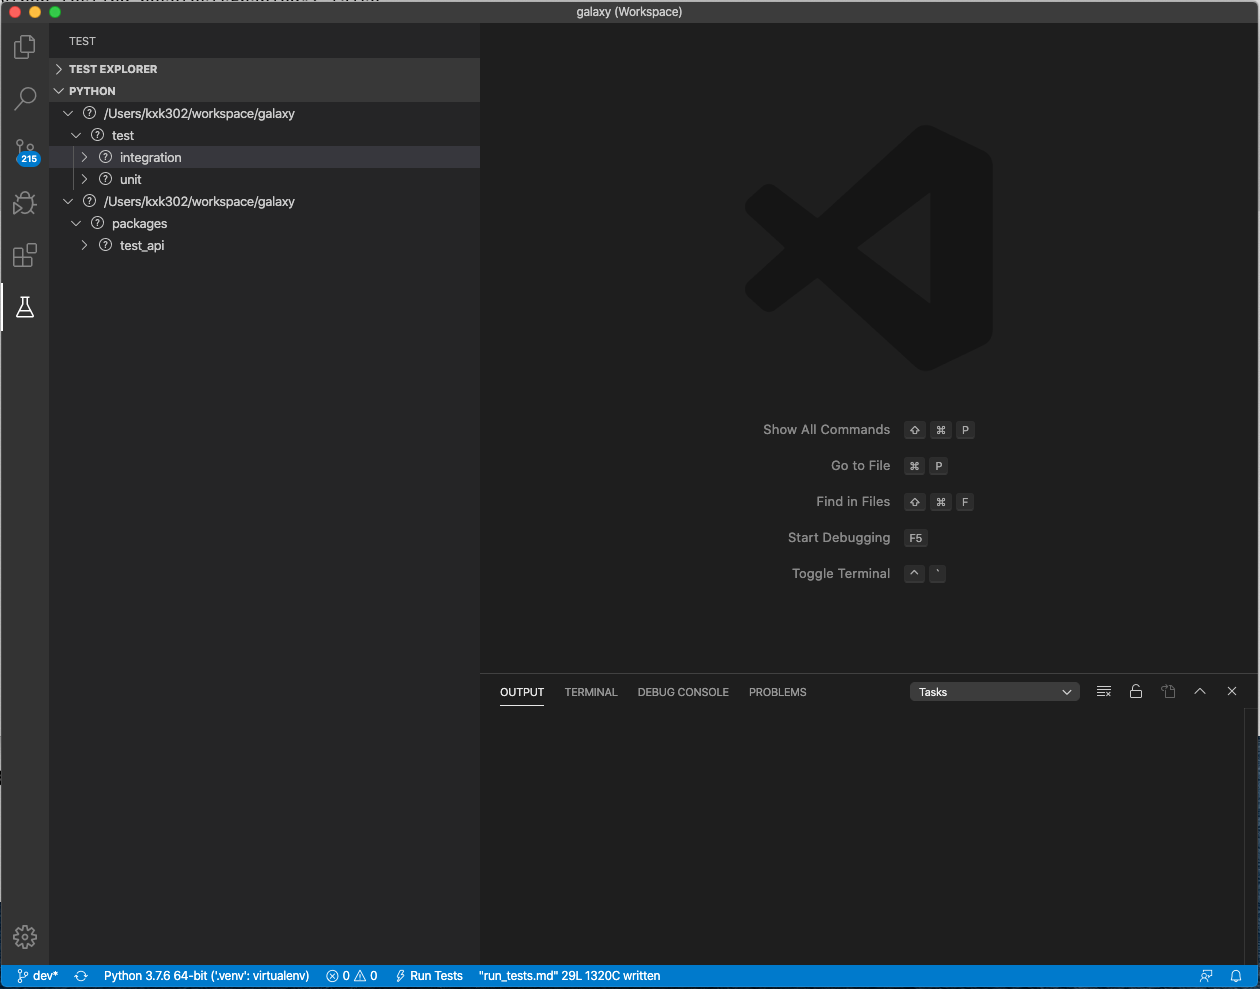
Expand integration/unit tests, select a test to display its source code in editor, add a breakpoint, and start the debugger by clicking on the debug icon (next to test name)
Debugging tests within GitHub actions
Sometimes it is necessary to debug tests that work locally. There are a few different strategies one could employ.
For the broadly filtered test workflows, a change confined to their workflow
file selects that workflow without starting the other broadly filtered suites. Changes to the shared
build_client.yaml workflow also run its callers: Playwright, integration
Selenium, startup tests, and the tool form harness. A change that also touches
source files still runs the suites selected by those source files. Scheduled
and manually dispatched runs are independent of these path filters.
When editing these filters, use ordered paths entries: include **, exclude
unneeded directories and .github/workflows/**, then include the workflow’s
own file and any reusable workflows it calls. Keep the push and pull request
filters in sync. A new reusable workflow must be included in each caller’s
filter so changes to it exercise the calling jobs. Narrow filters should also
include the shared configuration and scripts their jobs read.
If the YAML file has a strategy section that splits tests into multiple job runs, keep just the one that contains the failing test.
If the test never finishes, add -s to the options that run_tests.sh pass to pytest (i.e. -s needs to be after a --), so you can see live output.
The following diff adds -s and select a single shard from the job matrix:
diff --git a/.github/workflows/integration.yaml b/.github/workflows/integration.yaml
index 52cf06d311..6a2d90f235 100644
--- a/.github/workflows/integration.yaml
+++ b/.github/workflows/integration.yaml
@@ -98,7 +98,7 @@ jobs:
       - name: Run tests
         run: |
           . .ci/minikube-test-setup/start_services.sh
-          ./run_tests.sh --coverage -integration test/integration -- --num-shards=4 --shard-id=${{ matrix.chunk }}
+          ./run_tests.sh --coverage -integration test/integration -- -s --num-shards=4 --shard-id=1
         working-directory: 'galaxy root'
       - uses: codecov/codecov-action@v3
         with:
If that’s not enough and you need to snoop around the process, halting it and inspecting what is going on it’s helpful to log into the GitHub runner and run the test manually. You can do this by injecting a step that inserts an SSH session via tmate, then use your favorite tools like py-spy or similar to look at the test while it’s failing or getting stuck.
Note that you probably don’t want to do this on a PR branch, where all your tests are still going to run. Instead run this only against your fork.
Debugging tests that run out of memory
You can profile the memory used in tests by installing
pytest-memray in your virtual
environment, activating it by setting memray = true in pytest.ini, then run
the problematic tests in the usual way. After the tests finish, a report is
produced by memray.
Note that pytest-memray cannot profile test classes that inherit from
unittest.TestCase .