Warning
This document is for an old release of Galaxy. You can alternatively view this page in the latest release if it exists or view the top of the latest release's documentation.
Galaxy Performance Tracking
Tracking performance over time and identifying slow queries in your Galaxy can be an extremely important thing to do, especially for larger Galaxies. A more in-depth tutorial is available at the Galaxy Training Network.
Most performance tracking requires sending metrics to a metrics collection server such as StatsD. This document assumes you have already deployed StatsD.
Gunicorn
There is some built-in Gunicorn support for performance logging. You can send Gunicorn’s internal metrics to a StatsD server by setting the –statsd-host and –statsd-prefix command line options for Gunicorn in the gravity section of galaxy.yml:
gravity:
   #...
   gunicorn:
     extra_args: '--statsd-host 127.0.0.1:8125 --statsd-prefix=gunicorn'
API / Route Timing Statistics
Galaxy provides middleware to automatically log the amount of time controllers take to execute and to send that data to a stats server. Using the stats server of your choice, you can calculate the relevant statistics to ensure that your Galaxy server is performing as expected.
The statsD configuration requires setting the following options in the galaxy section of config/galaxy.yml:
galaxy:
  #...
  statsd_host: 127.0.0.1
  statsd_port: 8125
  statsd_prefix: galaxy
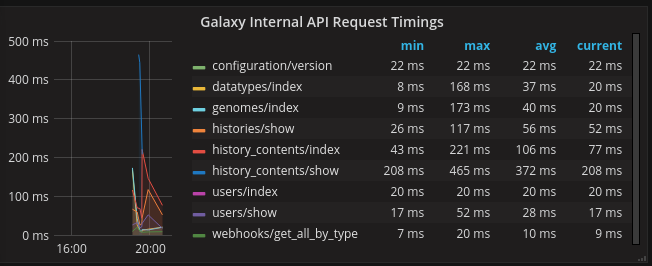
Most people visualize the statistics using something like Grafana: