Warning
This document is for an in-development version of Galaxy. You can alternatively view this page in the latest release if it exists or view the top of the latest release's documentation.
Galaxy Performance Tracking
Tracking performance over time and identifying slow queries in your Galaxy can be an extremely important thing to do, especially for larger Galaxies.
Most performance tracking requires sending metrics to a metrics collection server such as Graphite or StatsD. This document assumes you have already deployed a metrics server.
uWSGI
There is some built-in uWSGI support for performance logging. You can send uWSGI’s internal metrics to a carbon (Graphite) server by setting the carbon option in your galaxy.yml:
uwsgi:
   socket: ...
   carbon: 127.0.0.1:2003
Or a StatsD server via:
uwsgi:
   socket: ...
   stats-push: statsd:127.0.0.1:8125
The official documentation contains further information on uWSGI and stats servers. In the uWSGI Stats Server documentation, you can see an example of the sort of information that you will be able to collect. Note that you will need to make sure that the statsd pusher plugin is activated in your uWSGI servers.
Alternatively, you can use gxadmin to generate data ready to load in an InfluxDB database. In this case, you will need to add the stats option to your galaxy.yml:
uwsgi:
   socket: ...
   stats: 127.0.0.1:9191
And then run gxadmin like this:
gxadmin uwsgi stats_influx 127.0.0.1:9191
API / Route Timing Statistics
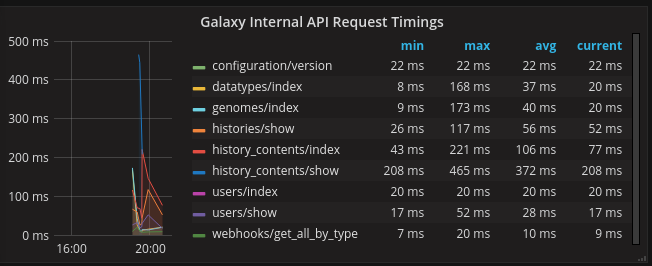
Galaxy provides middleware to automatically log the amount of time controllers take to execute and to send that data to a stats server. Using the stats server of your choice, you can calculate the relevant statistics to ensure that your Galaxy server is performing as expected.
The statsD configuration requires setting the following options in the galaxy section of config/galaxy.yml:
galaxy:
  #...
  statsd_host: 127.0.0.1
  statsd_port: 8125
  statsd_prefix: galaxy
Most people visualize the statistics using something like Grafana: